. 2016 Nov 8;7(45):73080-73100.
doi: 10.18632/oncotarget.11485.
Dandelion root extract affects colorectal cancer proliferation and survival through the activation of multiple death signalling pathways
Affiliations
- PMID: 27564258
- PMCID: PMC5341965
- DOI: 10.18632/oncotarget.11485
Dandelion root extract affects colorectal cancer proliferation and survival through the activation of multiple death signalling pathways
Pamela Ovadje et al. Oncotarget. .
Abstract
Dandelion extracts have been studied extensively in recent years for its anti-depressant and anti-inflammatory activity. Recent work from our lab, with in-vitro systems, shows the anti-cancer potential of an aqueous dandelion root extract (DRE) in several cancer cell models, with no toxicity to non-cancer cells. In this study, we examined the cancer cell-killing effectiveness of an aqueous DRE in colon cancer cell models. Aqueous DRE induced programmed cell death (PCD) selectively in > 95% of colon cancer cells, irrespective of their p53 status, by 48 hours of treatment. The anti-cancer efficacy of this extract was confirmed in in-vivo studies, as the oral administration of DRE retarded the growth of human colon xenograft models by more than 90%. We found the activation of multiple death pathways in cancer cells by DRE treatment, as revealed by gene expression analyses showing the expression of genes implicated in programmed cell death. Phytochemical analyses of the extract showed complex multi-component composition of the DRE, including some known bioactive phytochemicals such as α-amyrin, β-amyrin, lupeol and taraxasterol. This suggested that this natural extract could engage and effectively target multiple vulnerabilities of cancer cells. Therefore, DRE could be a non-toxic and effective anti-cancer alternative, instrumental for reducing the occurrence of cancer cells drug-resistance.
Keywords: cancer; gene expression; natural health product; oxidative stress; phytochemical composition.
Conflict of interest statement
CONFLICTS OF INTERESTS
The authors do not have any conflict of interests
Figures
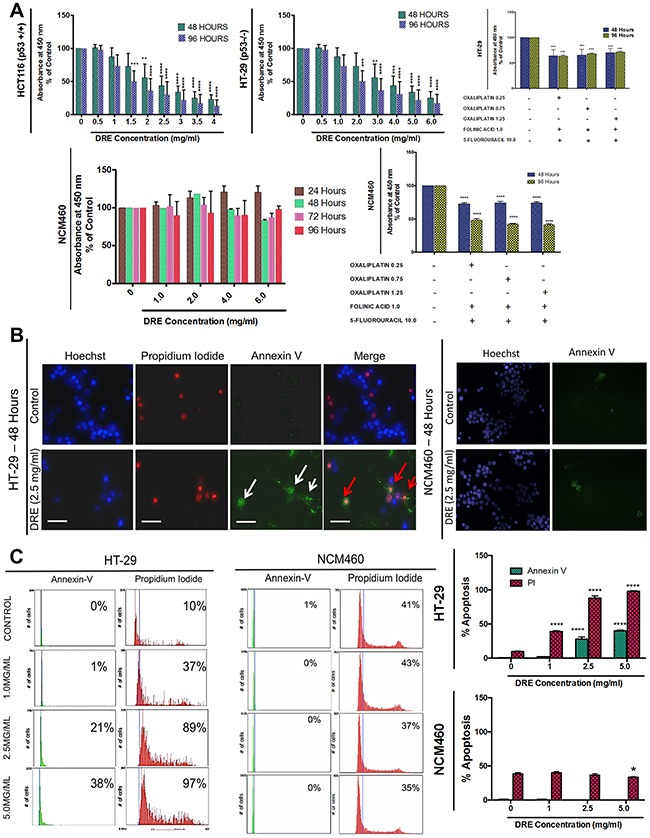
Colon Cancer cells (HT-29 [p53−/−] and HCT116 [p53+/+]) and normal colon mucosal epithelial cells (NCM460) were treated with increasing doses of DRE and analyzed for anticancer effects. A. Viability of colon cells treated with DRE. Results are expressed as mean ± SD from quadruplicates of 3 independent experiments. **P<0.001, ****P<0.0001 B. Hoechst (Blue), Annexin V (Green) and Propidium Iodide (PI) (Red) staining of DRE-treated cells, 48 hours after treatment to assess induction of apoptosis. Fluorescence images were obtained at 400X magnification; Scale bar = 25 μm. Apoptotic cells were quantified using image-based cytometry C. *P<0.05, ****P<0.0001.
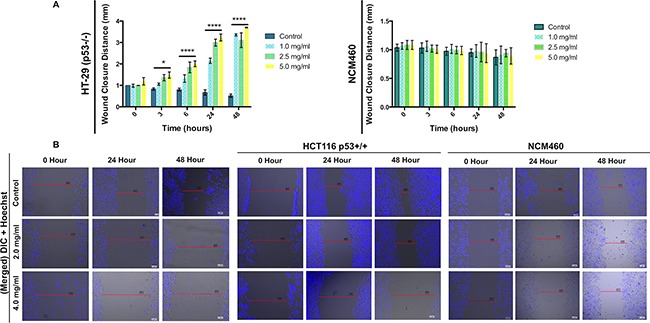
A. Quantification of wound closure distance in HT-29 and NCM460 cells at different treatment times (0, 3, 6, 24 and 48 hours). Values are expressed as mean ± SD **P<0.001, ****P<0.0001. B. Representative micrographs of wound healing assay in HT-29, HCT116 and NCM460 cells.
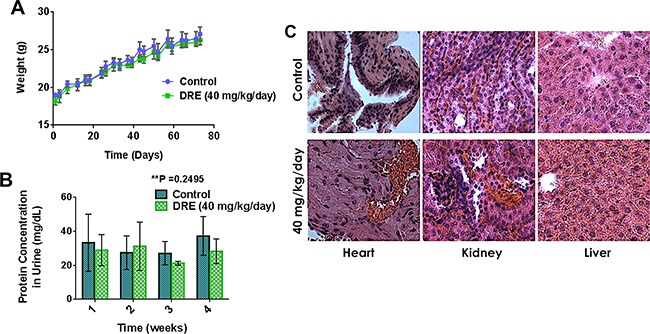
Balb/C mice were separated into two groups, one group on oral administration of PBS – control and the other group on oral administration of DRE (40 mg/kg/day) for a period of 75 days. A. Weight of mice in each group for the duration of the study. B. Urine was obtained from mice every week for the last 4 weeks of the study. Protein urinalysis was carried out using urine dipstick and the Bradford protein assay. C. Hematoxylin and Eosin staining of tissues (hearts, kidneys and livers). Images were obtained on a brightfield microscope at 63X Objective.
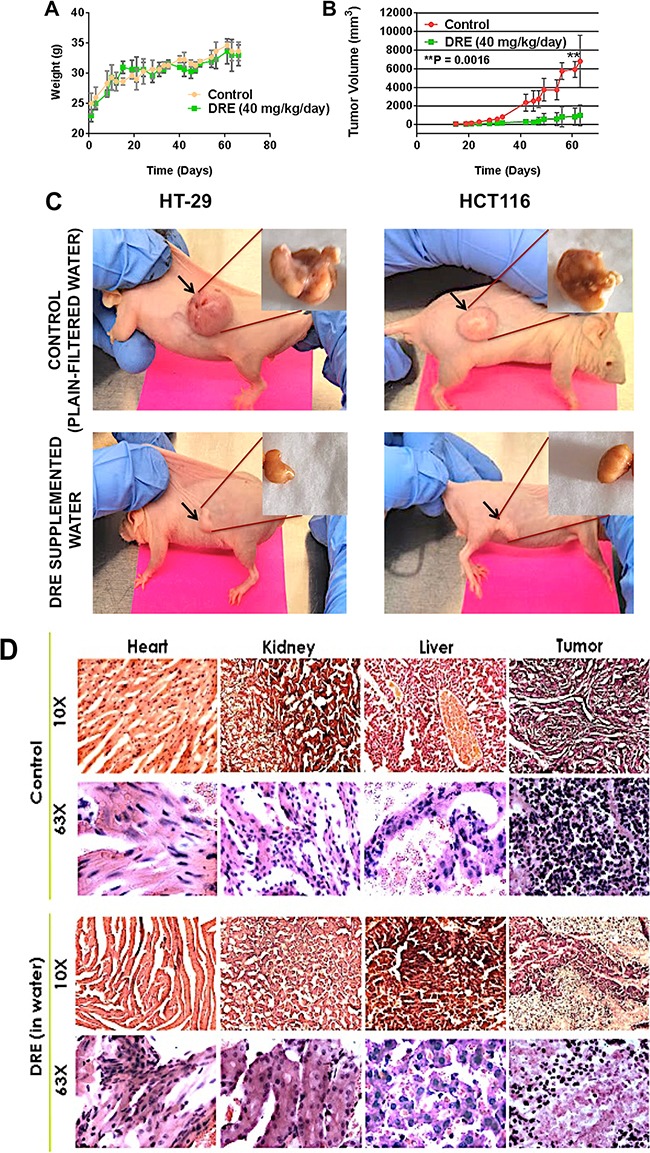
Immunocompromised CD-1 nu/nu mice were subcutaneously injected with 2 × 10⁶ colon cancer cells (HT-29 on the left flank and HCT116 on the right flank). A. Mice weights every other day. B. The tumor volumes were measured using a standard caliper and the tumor volumes were calculated according to the formula π/6 × length × width. C. Images of mice tumors week 9 of the study, showing differences in the tumor sizes between the control, untreated group and the DRE group. D. Hematoxylin and Eosin staining of tissues. Images were obtained on a brightfield microscope at 63X Objective.
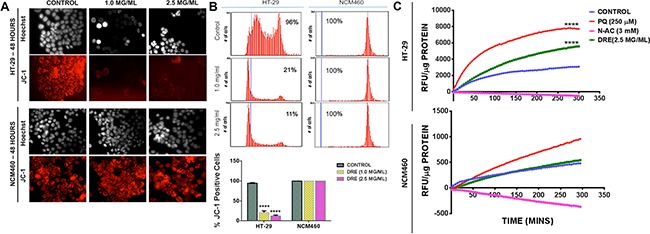
JC-1 staining on HT-29 and NCM460. Red fluorescence intensity was measured by fluorescence microscopy (Magnification: 400X) A. and image based cytometry B. to detect the loss of the mitochondrial membrane potential. C. ROS production was measured in isolated mitochondria. Fluorescence readings were taken in 5-minute intervals for 5 hours at Ex. 560 nm and Em. 590 nm and expressed as relative fluorescence units (RFU) per μg protein. Statistics – Two way ANOVA ****P<0.0001.
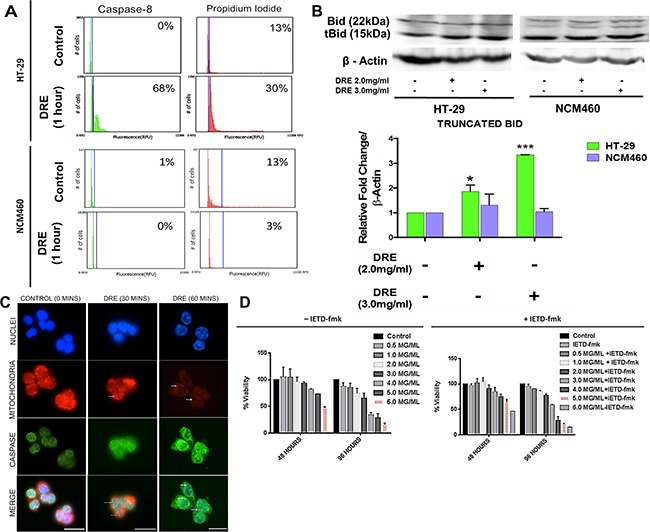
A. Image-based cytometry of HT-29 and NCM460 cells stained with caspase-8 and incubated for an hour and counterstained with propidium iodide. B. Western blots and densitometry analysis of protein levels of truncated Bid. *P<0.05 C. Immunocytochemistry of activated caspase-8 and mitochondrial localization – MitoTracker (Red) and anti-caspase-8 antibody (Green), Hoechst 33342 (blue). Images were obtained at 400X objective. White arrows indicate the dispersion of MitoTracker Red, indicative of a loss of mitochondrial membrane potential and the magenta arrows show the presence of active caspase-8 in the nucleus following DRE treatment. Scale bars = 25 μm. D. Prior to DRE treatment, HT-29 cells were pre-treated with a caspase-8 specific inhibitor, IETD-fmk, for an hour at indicated concentrations and analyzed for cell viability.
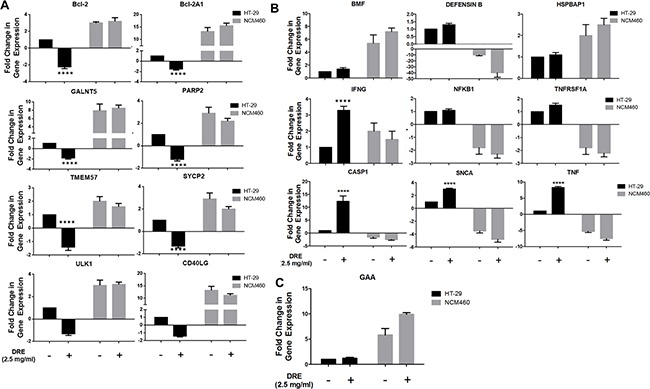
Differential expression levels of cell death genes affected by DRE treatment A. Anti-apoptotic genes B. Pro-apoptotic genes C. Pro-autophagic genes. The results are average of three independent experiments. *P<0.05 **** P<0.0001.
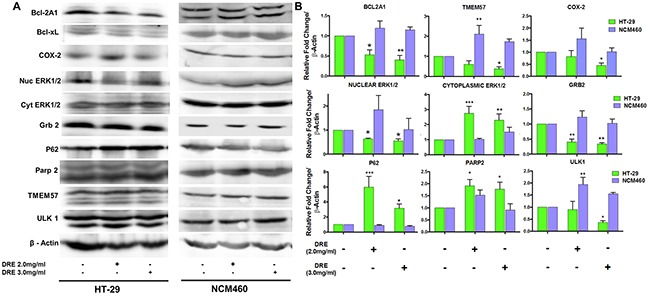
A. Western blots of proteins involved in programmed cell death and cell survival and inflammation B. Densitometry quantification of western blot analysis from three independent experiments. *P<0.05, **P< 0.001.
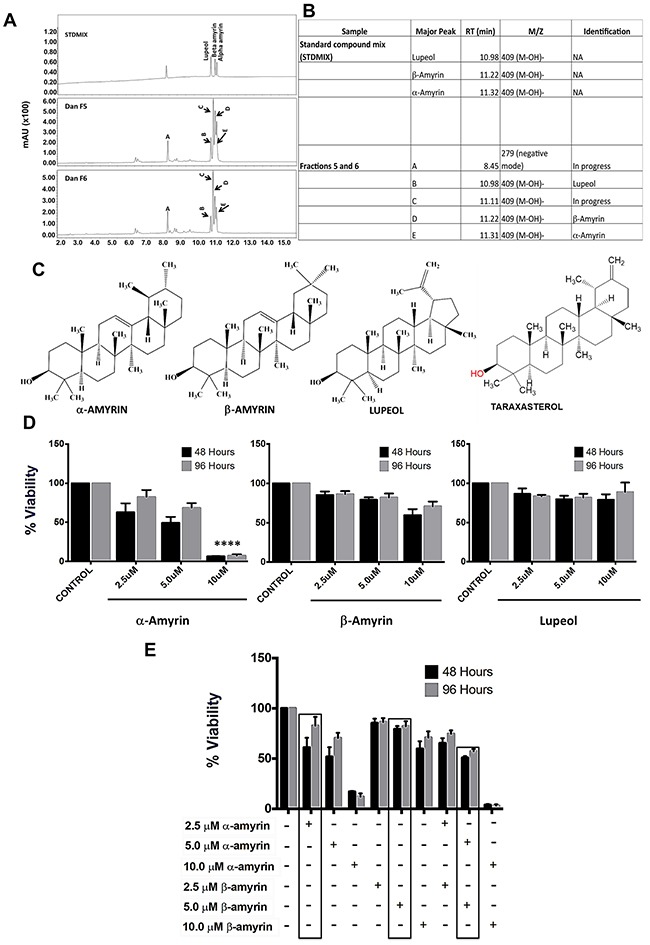
A. UPLC-DAD-MS chromatogram of bioactive fraction #5 and #6, along with a standard mix of known compounds B, C. Identified compounds (by ChemDraw) in bioactive fractions #5 and #6. These triterpenes are isomers (426.7g/mol). D. Viability of HT-29 cells treated with α-amyrin, β–amyrin and lupeol ****P<0.0001 E. Compounds were analyzed alone and in combination with each other to assess combined effect in cancer cells. α-amyrin and β-amyrin showed an additive effect at slightly lower doses than the effective concentrations.
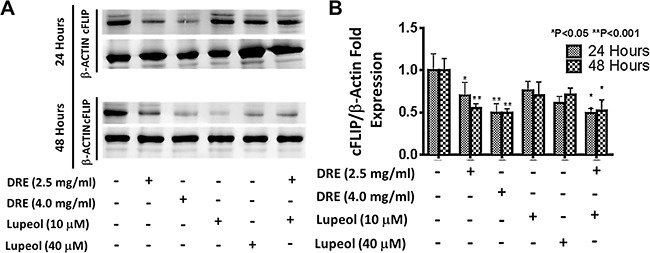
Following treatment, cell lysates were obtained and proteins were separated on a gel. The proteins were transferred onto a PVDF membrane and probed for cFLIP levels, using β-actin as a loading control. Imaged blot of cFLIP expression levels and densitometry analysis of expression levels, compared to β-actin loading control.
References
-
- Ganesan A. The impact of natural products upon modern drug discovery. Current Opinion in Chemical Biology. 2008;12:306–17. - PubMed
MeSH terms
Substances
LinkOut - more resources
Full Text Sources
Other Literature Sources
Research Materials
Miscellaneous